

Modern businesses are shifting from traditional reporting methods to intelligent, real-time analytics systems. One of the most powerful changes comes from comparing Odoo dashboards vs manual reporting and understanding the role of the Odoo analytics dashboard in transforming decision-making and performance tracking.
Odoo Dashboards vs Manual Reporting: A Clear Difference
The comparison of Odoo dashboards vs manual reporting highlights a major shift in how businesses handle data.
Manual Reporting
Traditional manual reporting involves:
- Collecting data from spreadsheets or multiple systems
- Entering data manually into Excel or documents
- Creating static reports that quickly become outdated
- Spending significant time on data preparation
This approach is slow, error-prone, and lacks real-time visibility.
Odoo Dashboards
In contrast, Odoo dashboards in Odoo provide:
- Automated data collection from all business modules
- Real-time updates without manual effort
- Visual dashboards instead of static reports
- Centralized access to business performance metrics
This makes dashboards significantly faster, more accurate, and more scalable than manual reporting.
What Is an Odoo Analytics Dashboard?
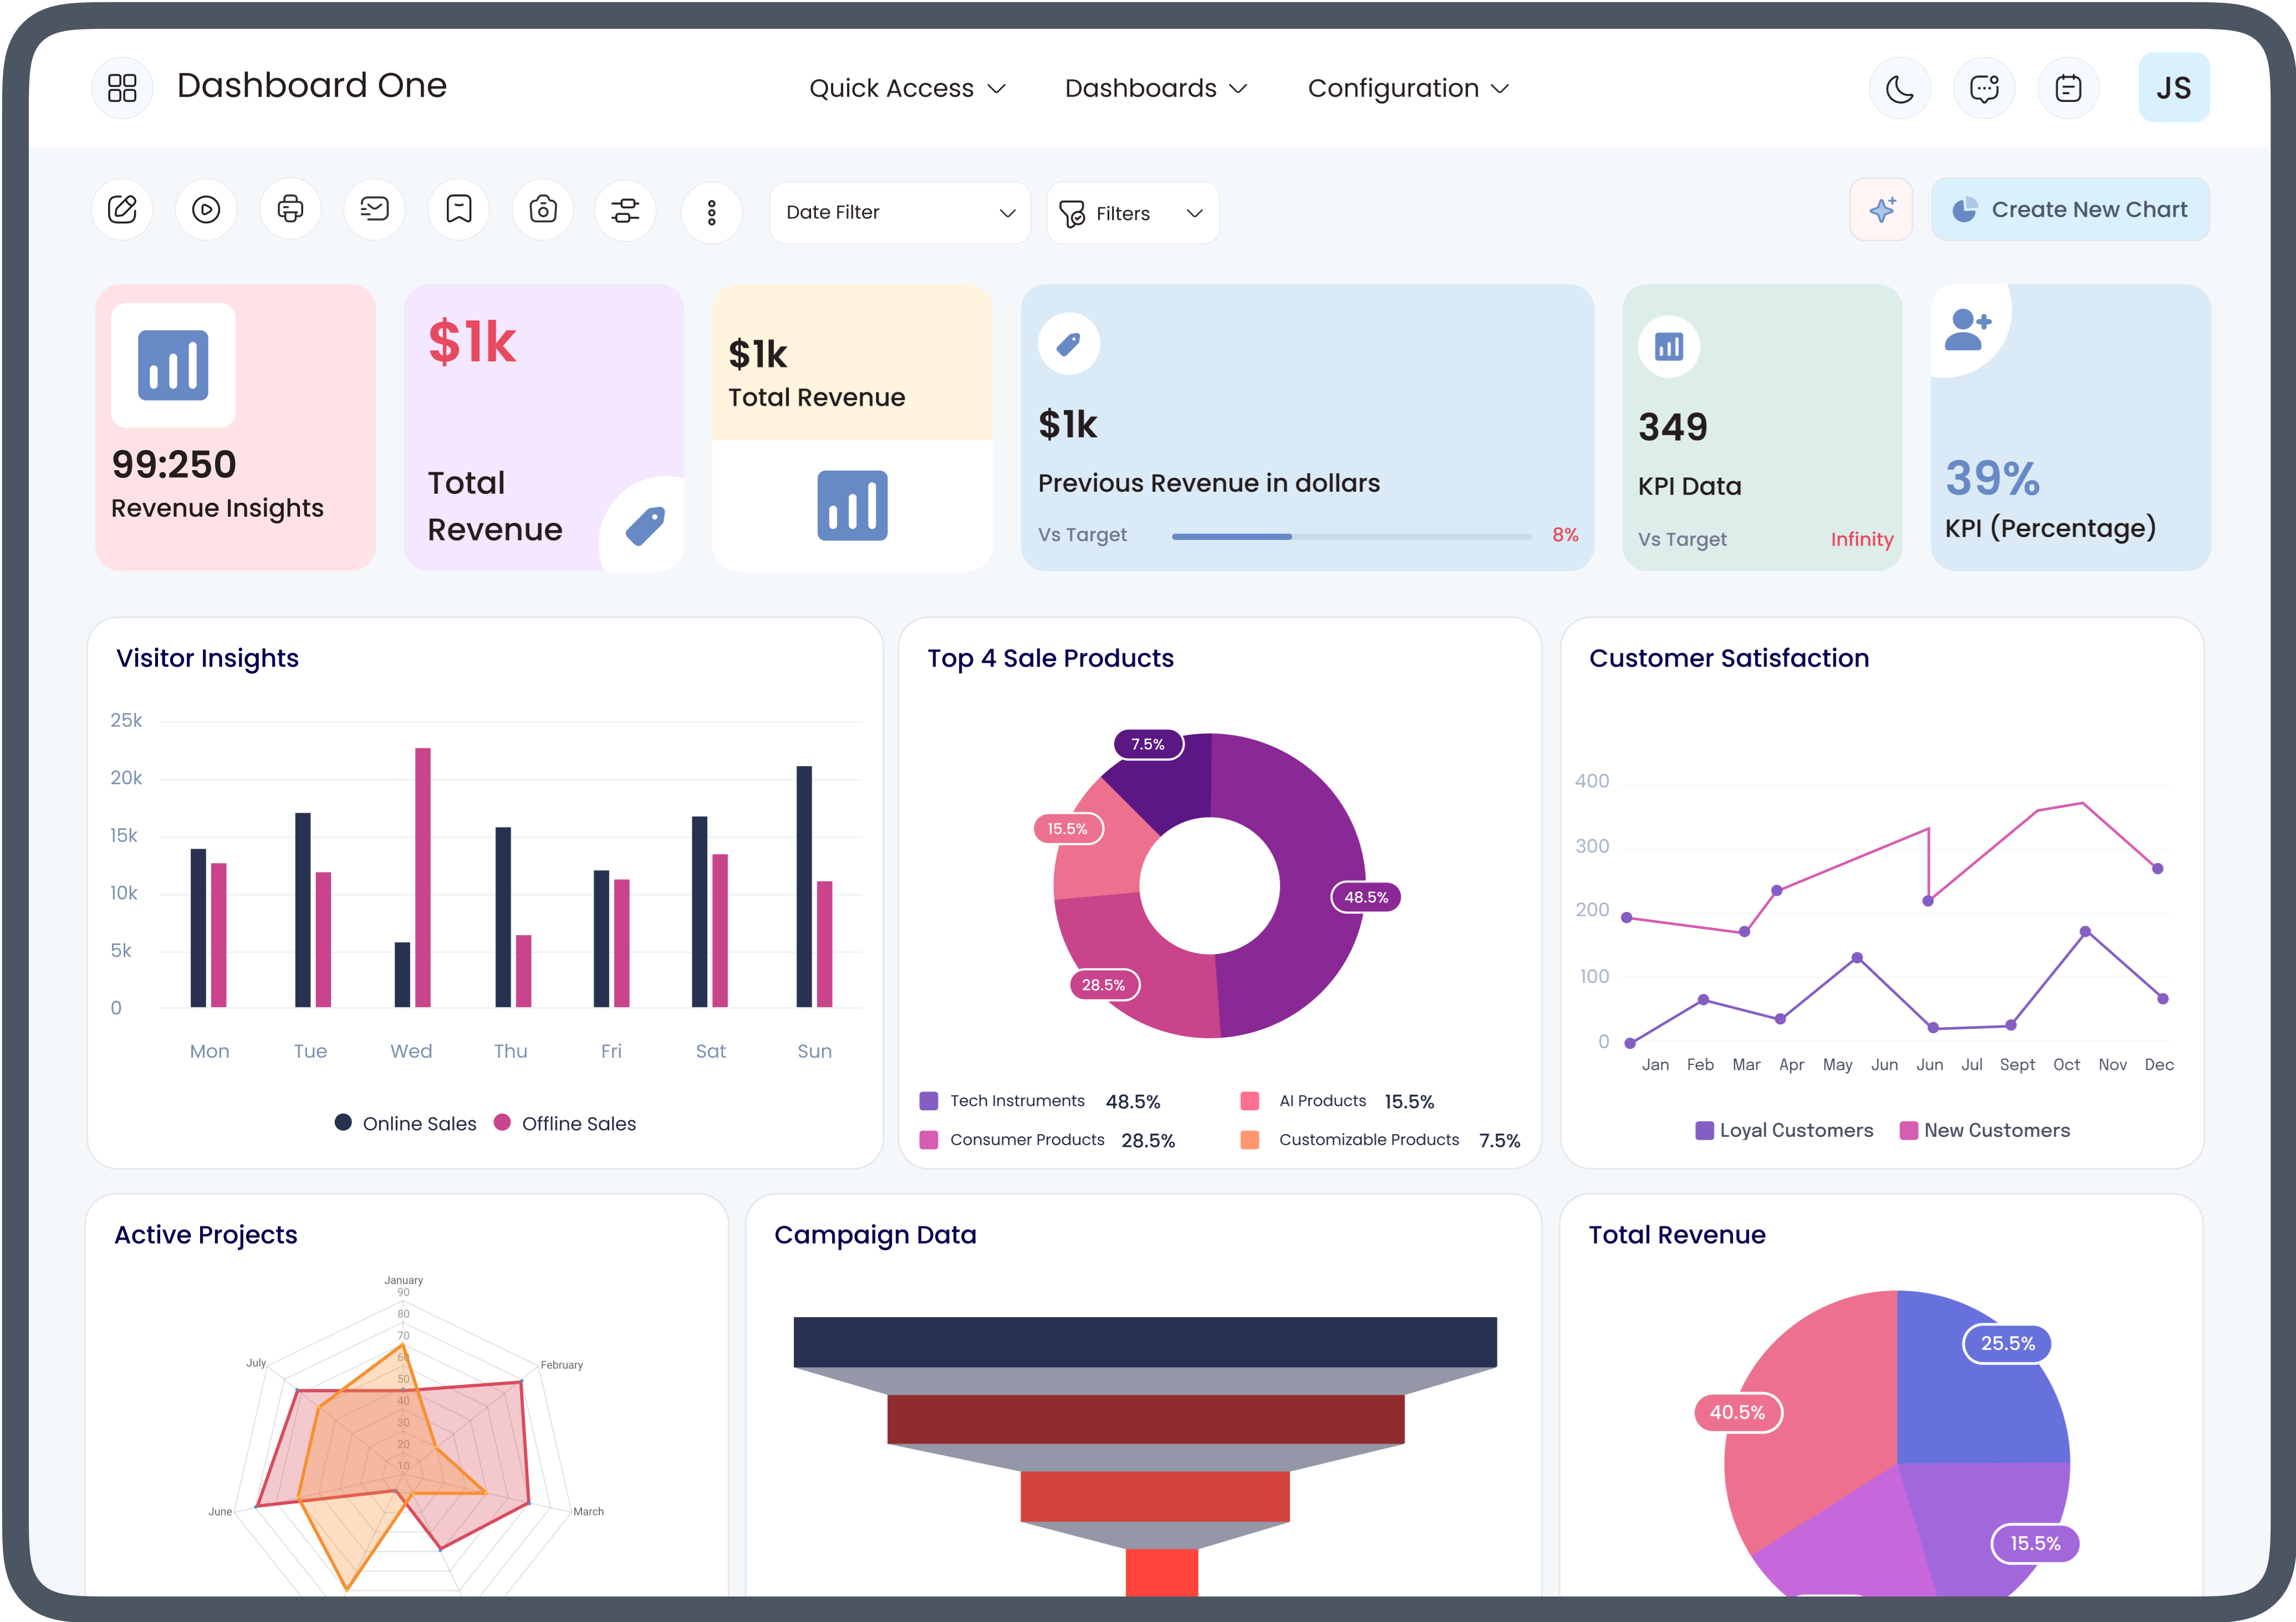
An Odoo analytics dashboard is an interactive visual reporting system that transforms raw business data into meaningful insights.
It typically includes:
- KPI cards (sales, revenue, expenses, etc.)
- Graphs and charts for performance trends
- Filters for custom data analysis
- Real-time synchronization across departments
Unlike traditional reports, it focuses on visual interpretation of data, helping users understand performance at a glance.
How Odoo Analytics Dashboards Transform Business Reporting
The transformation from manual reporting to Odoo analytics dashboards is not just technical—it changes how businesses think and operate.
1. From Static Reports to Real-Time Insights
Manual reports are outdated the moment they are created. Odoo dashboards provide live data, enabling instant decision-making.
2. From Data Collection to Data Visualization
Instead of spending hours gathering data, businesses get ready-made visual insights through charts and graphs.
3. From Departmental Silos to Centralized Reporting
All departments—sales, finance, inventory, HR—feed into a single dashboard system, reducing fragmentation.
4. From Guesswork to Data-Driven Decisions
With Odoo analytics dashboard, managers no longer rely on assumptions. They base decisions on accurate KPIs and trends.
5. From Manual Errors to Automated Accuracy
Automation in Odoo eliminates human errors common in spreadsheet-based reporting.
6. From Slow Analysis to Fast Action
Dashboards allow quick drill-down analysis, helping businesses react faster to opportunities and risks.
Why Businesses Prefer Odoo Dashboards Over Manual Reporting
When comparing Odoo dashboards vs manual reporting, the advantages are clear:
- Faster reporting cycles
- Higher accuracy
- Better scalability
- Improved collaboration
- Smarter decision-making
This makes Odoo a preferred solution for modern enterprises.
Conclusion
The shift from manual reporting to Odoo analytics dashboards represents a major evolution in business intelligence. While manual reporting is slow and fragmented, Odoo dashboards deliver real-time, automated, and visually rich insights.
Ultimately, Odoo dashboards vs manual reporting is not just a comparison—it is a transformation from outdated processes to intelligent, data-driven business management.