

If you ever tried to compare two currencies that don't involve the US dollar, you probably ran into something called cross rates. And honestly, once you understand how they work, they open up a whole new way of reading the market.
This article is for traders, analysts, fintech builders, and anyone curious about how to turn raw exchange data into something actually useful.
What Are Currency Cross Rates and Why They Matter
Currency cross rates are exchange rates between two currencies, calculated without converting to USD first. So instead of going EUR to USD to JPY, you get EUR/JPY directly. Simple idea, but powerful when you start working with it.
Most traders focus on major pairs. But the real picture of what's happening in the market often shows up in crosses. A shift in EUR/GBP or AUD/JPY can tell you a lot about regional sentiment, risk appetite, and capital flows.
For anyone building a market analysis tool, this data is not optional. It's core.
Building the Tool: Where to Start
You don't need to be a software engineer to think through this. Start with what you want the tool to do.
A good market analysis tool using forex cross data should:
-
Pull live and historical exchange rates
-
Show how pairs move relative to each other
-
Highlight unusual shifts or momentum
-
Let you filter by region, currency type, or volatility level
The first step is finding a reliable data source. Platforms like Vunelix give you real-time prices for 2000+ forex pairs, including full cross rate coverage across 180+ currencies. That's a solid foundation to build on.
Choosing the Right Data Layer
Your tool is only as good as the data behind it. You want:
-
Real-time rates updated continuously
-
Historical data going back years (Vunelix has over 30 years of historical currency data)
-
Clean, consistent formatting so your calculations don't break
One thing people skip early on is thinking about data depth. Having today's rates is fine. But if you want to build trend detection or backtesting features, you need history.
Structuring Your Analysis Logic
Once the data is flowing, you need to decide what to do with it. Here are a few common approaches:
Correlation tracking: Find which crosses move together. EUR/CHF and USD/CHF often mirror each other. Knowing that helps you avoid doubling up on the same risk.
Momentum scoring: Assign scores to currency pairs based on how much they've moved over a given period. This helps surface the pairs worth watching right now.
Divergence alerts: When two correlated pairs stop moving together, something changed. Building alerts for this can catch early market signals.
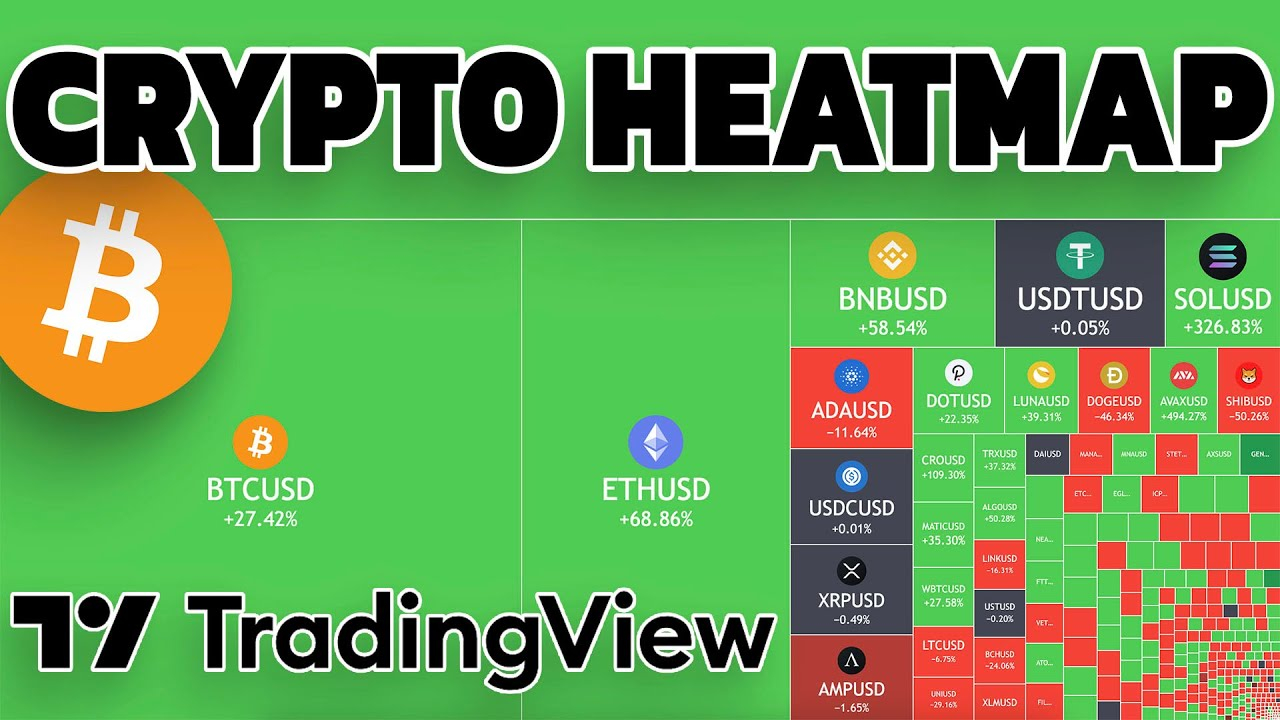
Heatmap views: Vunelix already offers market heatmaps. If you're building your own tool, heatmaps are a great way to show strength and weakness across currencies at a glance.
Using the Data for Real Decisions
Here's a practical example. Say you're watching the yen. You pull up JPY crosses: USD/JPY, EUR/JPY, GBP/JPY, AUD/JPY. If they're all moving in the same direction, the yen itself is the story. If only one pair is moving, it's more about the other currency.
That kind of reading takes seconds when you have the right layout. It takes much longer if you're manually checking pairs one by one.
This is exactly why building or using a tool with cross rate data built in saves time and reduces errors in analysis.
Tools You Can Build Around This Data
Depending on your audience and use case, here are some tool ideas that work well:
-
A currency strength meter that ranks currencies daily
-
A scanner that flags crosses breaking key levels
-
A historical comparison dashboard showing how a pair behaved in past market cycles
-
A simple screener that filters by volatility or trend direction
Fintech companies building client-facing products can use this data layer to power dashboards, reports, or embedded widgets.
Educators and researchers can use it for case studies, backtesting historical scenarios, or teaching students how global currency movements connect to macro events.
Why Free Platforms Can Be a Strong Starting Point
Paid data APIs can get expensive fast. For many analysts and developers, starting with a free platform makes sense, especially when testing ideas.
Vunelix is free and gives you access to live forex rates, crypto prices, stock data from 30 countries, currency converters, and cross rate tables. It doesn't offer an API, but as a research and analysis platform, it covers a lot of ground for understanding market behavior before you scale anything.
The cross rate table on Vunelix, for example, shows a full grid of major currency pairs updated in real time. You can see the matrix view, track pair movements, and cross-reference quickly.
Common Mistakes When Working With Cross Rate Data
A few things people get wrong early on:
Ignoring bid-ask spreads: The rate you see isn't always the rate you'd trade. For pure analysis this matters less, but keep it in mind if your tool feeds into execution decisions.
Treating all data as equally liquid: EUR/USD is extremely liquid. Some exotic crosses are not. Price movements in illiquid pairs can look dramatic but mean very little.
Not normalizing for time zones: Currency markets run 24 hours. If you're comparing end-of-day prices across pairs, make sure you're using consistent timestamps.
Overlooking weekend gaps: Markets close Friday evening and reopen Sunday. That gap matters for any tool that tracks overnight or multi-day moves.
Conclusion
Building a market analysis tool around currency cross rates data gives you a fuller, more nuanced view of global forex markets. The pairs people overlook often hold the clearest signals. Start with solid data, think through your analysis logic, and build features that match what your audience actually needs.
Whether you're a trader wanting a personal edge, an analyst building something for clients, or a developer working on a fintech product, cross rate data is worth getting comfortable with. Platforms like Vunelix make it easier to access that data without a big upfront cost, so there's no real reason to skip it.
Frequently Asked Questions
What are currency cross rates in simple terms?
Cross rates are exchange rates between two currencies that don't include the US dollar as a middle step. For example, EUR/JPY is a cross rate. It shows you directly how many yen one euro buys.
Why should traders pay attention to cross rates?
They reveal currency-specific strength or weakness. If all JPY pairs move together, the yen itself is the driver. Cross rates help you isolate what's actually happening in the market.
Can beginners use cross rate data for analysis?
Yes. You don't need to be an expert to start. Even simple tools like heatmaps or currency strength meters built on cross data are beginner-friendly and useful.
Where can I find reliable cross rate data for free?
Vunelix (vunelix.com) provides real-time cross rate tables, currency converters, and market data for 180+ currencies. It's free and designed for traders, analysts, and researchers.
How is cross rate data different from major pair data?
Major pairs always include the USD. Cross rates do not. They give you a more direct comparison between two non-dollar currencies, which can be more useful depending on your market focus.
Can I build a market analysis tool without coding skills?
Yes, to a degree. Many platforms let you build dashboards, set up alerts, or create custom views without writing code. For more advanced tools, some basic scripting helps, but it's not mandatory to get started.
How often does cross rate data update?
On platforms like Vunelix, rates update in real time during market hours. This matters for active traders and anyone building tools that depend on current prices.
Is historical cross rate data useful for analysis?
Very much so. Historical data lets you backtest ideas, study how pairs behaved during past market events, and build trend-detection logic. Vunelix offers over 30 years of historical currency exchange data.